Automatic generation of OEE reports
OEE key figures and reports at the push of a button, per line and across production facilities, integrated in our control systems.
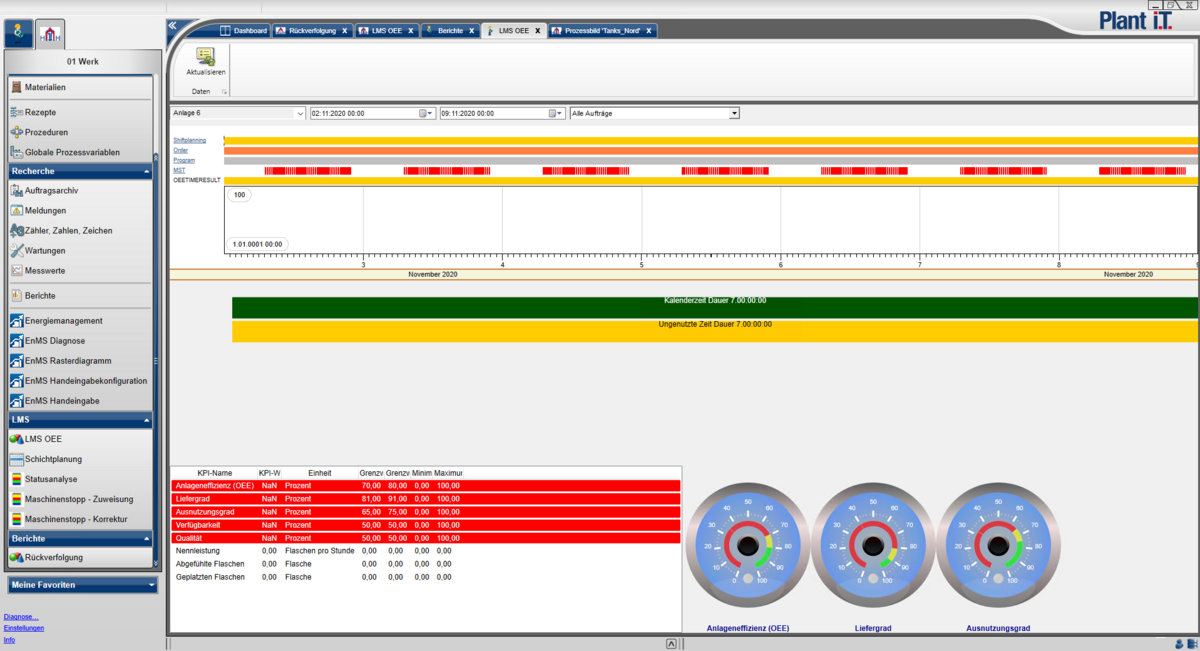
Since we can link all production data with our process control systems, we are also able to provide OEE analyses and detailed representations of the plant efficiency of individual lines and machines. Depending on actual wishes, reports can be used to compare the utilised capacity of the various lines as well as the adherence to performance characteristics. Various types of dashboards, tables or lists are available for the graphical presentation of data.
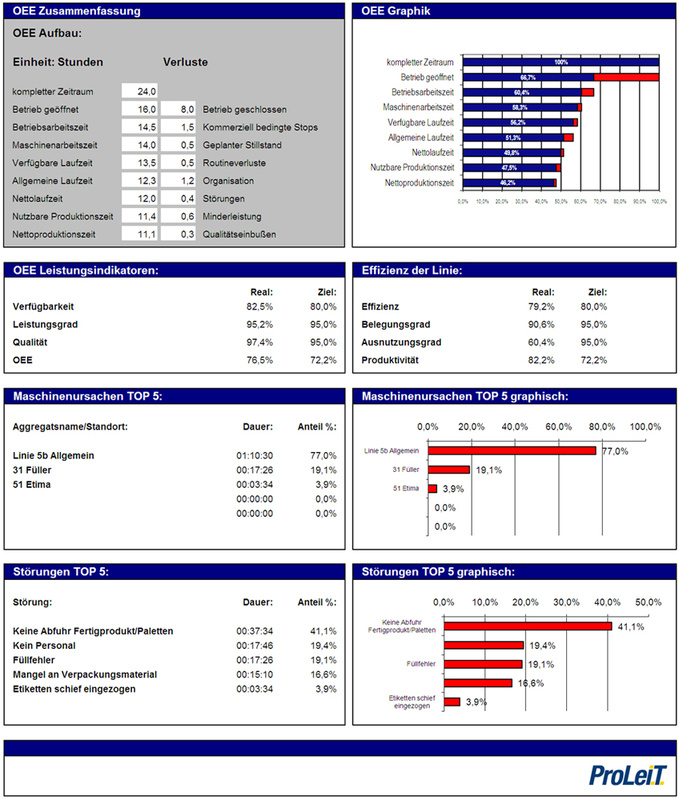
The next example of an OEE report links information from the areas of shift, item, machine and fault data. The shift report contains central data for filling and shift management and summarises the individual batches of the respective shifts. It also provides detailed evaluations of non-productive periods and faults. It includes among other things:
- Shift information (duration, shift number, shift supervisor, team strength)
- Non-productive periods (breaks, set-up times …)
- Orders filled during the shift (item number, quantity)
- Finished product number, item
- Faults at the filler
- Key figures (utilisation)
The item report provides production managers with an overview of the filled quantity of an item as well as the key figures. Any discrepancies between the planned and actual filled quantity are thus easily identifiable. Production managers can therefore review their plans and, if necessary, adjust them accordingly.
The machine and fault reports support troubleshooting at individual machines or the entire filling plant. Faults are displayed in a hit list in order to document weak points at the machine or its environment. Inspection and lubricating intervals are specified as an absolute time mark.
The quality reports document production which is in line with standards. The CIP report contains all the data of the used cleaning agents, disinfectants and those responsible, as well as the respective microbiological laboratory data.
The effective production time and, therefore, a parameter for the actual performance are determined through the automatic acquisition of faults and loss of production time due to reduced plant speed. Quality losses are monitored on the basis of deviations between actual production and nominal capacity. All this data is used to generate the OEE key figure and graphically displayed as a report.


